Since the third quarter of 2020, most of the global economy has been in a reflationary cycle, meaning that we're getting rising economic activity, rising inflation, and rising long-term Treasury yields from very low levels.
Most asset classes have benefited from it, but going forward if this trend continues, rising Treasury yields would put pressure on overstretched growth stock valuations and financial assets across the board more generally. Those rising yields are less of a problem, but still relevant in multiple ways, for cyclical/value stocks and other assets.
A Global Crash and Bounce
The world had a big deflationary shock in Q1 and Q2 of 2020 as the pandemic and associated economic shutdowns spread around the world.
Commodity prices collapsed first, back when the pandemic was focused on China (a major commodity importer), but then global equities fell when it became clear that the pandemic was spreading globally and that governments were shutting down their economies.
A dollar shortage and liquidity event occurred, and due to this there was even temporary forced-selling of Treasuries and gold at the worst part of the March 2020 crash. The price of WTI crude briefly went negative in April 2020 due to folks having nowhere to store it and being willing to pay someone to take it off their hands.
Starting in late March, a monetary and fiscal response at a scale that hasn't been seen since World War II was initiated by the United States and countries around the world, resulting in a massive increase in broad money supply. Governments ran huge deficits, and their central banks created new base money to buy most of the bonds to pay for those deficits.
In the United States, for example, the Federal Reserve came in with a liquidity bazooka and bought $1 trillion worth of Treasuries in a three-week period from late March through mid April with new base money, and Congress passed the $2.2 trillion CARES Act in late March that President Trump signed into law. A number of additional stimulus add-ons, and ongoing $80 billion monthly Treasury purchases by the Fed, continued since then.
Unemployment checks were paid, stimulus checks were mailed, hard-hit corporate sectors were bailed out, small businesses were given loans that turn into grants, aid was given to stressed healthcare systems, and so forth, which is what kept a lot of people in their homes and out of bankruptcy, having gone into this crisis in an already-leveraged state.
And much of this was funded by the Fed buying the Treasury Department's bond issuance with new base money creation.
The Two "Nuclear Keys", Initiated
The Federal Reserve can create base money out of thin air in a process they call "quantitative easing" or QE for short, but has very limited methods to inject it into the broad money supply. They can only buy bonds and certain other assets with it. They have no way to send money to real people and businesses in the economy, outside of financial markets.
The Treasury Department, on behalf of Congress and the President, can send money out to people and businesses, but needs to issue bonds associated with that spending, which just moves money around. The bonds pull capital out from one place (the lenders) and puts it in another place (where it is spent). Therefore, the government also doesn't have many ways to directly increase the broad money supply within the context of the existing legal structure.
However, the combination of the Treasury Department and the Fed working together, with the Treasury Department sending checks out into the broad money supply and the Fed creating new base money to buy the bonds associated with that spending (rather than extracting that money from real lenders buying the bonds with existing money), outright increases the broad money supply, as described here.
This chart shows the year-over-year change in dollar terms for the broad money supply, the Fed's balance sheet, and government transfer payments:
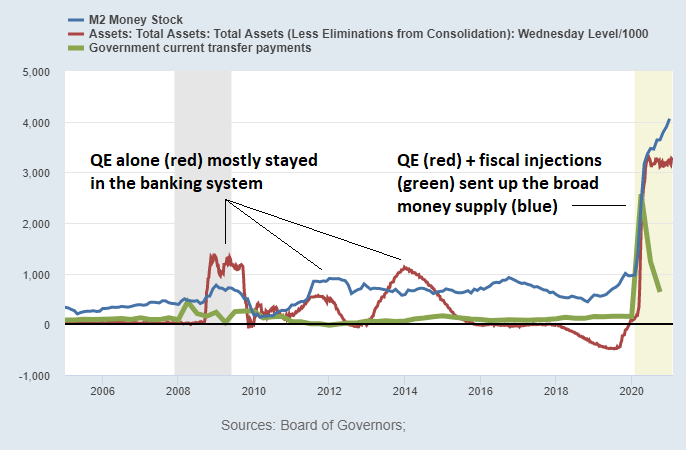
Chart Source: St. Louis Fed
As an analogy, when it comes to outright money-printing, the Treasury Department and the Fed each have one of the two nuclear keys that are required to do it, like how two top-ranked military personnel are required to launch an authorized nuclear strike with their keys/codes. Neither the Treasury Department nor the Fed can outright print money unilaterally in most situations, but if they both participate with their half of the process, it can be done.
Of course, a massive law change could allow the Treasury Department to override the Fed and therefore give both "nuclear keys" to Congress to outright print money in the unilateral sense, and there are some legal loopholes for the Treasury Department to act unilaterally (since, ultimately, government is the issuer of its currency), but those would be another story altogether. Within the existing system, both sides are required.
Here's the historical year-over-year percent change in the broad money supply (M2) for the United States, which shows how unusual this last year was:
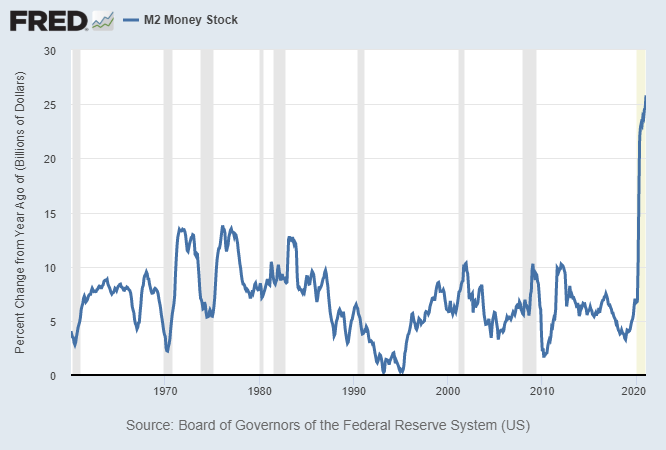
Chart Source: St. Louis Fed
If we look at major countries' broad money supply growth since the beginning of 2020, here are the approximate numbers:
- United States: 25%
- Canada: 18%
- UK: 14%
- Euro Area: 10%
- China: 10%
- Japan: 10%
Asset Inflation and Commodity Reflation
Throughout the year since the money-printing began, the combination of supply chain disruptions and significant broad money supply growth started to have an upward impact on inflation expectations and commodity prices from the low point, particularly in dollar terms since the United States has been the biggest printer over the past year.
Gold prices touched new all-time highs in 2020 and have been consolidating for several months. Iron ore prices went to 9-year highs. Silver and copper prices went to 8-year highs. Wheat and soybean prices went to 6-year highs.
Unlike many commodities, beef and poultry were already experiencing steady inflation pressures before the pandemic, and they blew out to big highs in 2020. Here's beef:
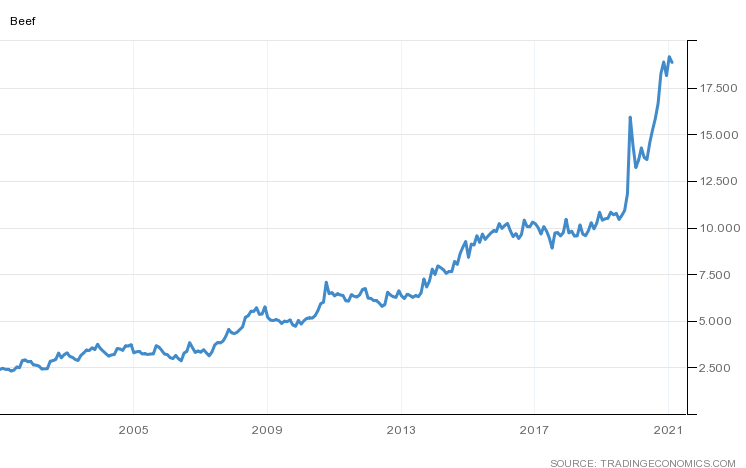
Chart Source: Trading Economics
Plus, lumber absolutely soared due to the out-of-city housing boom:
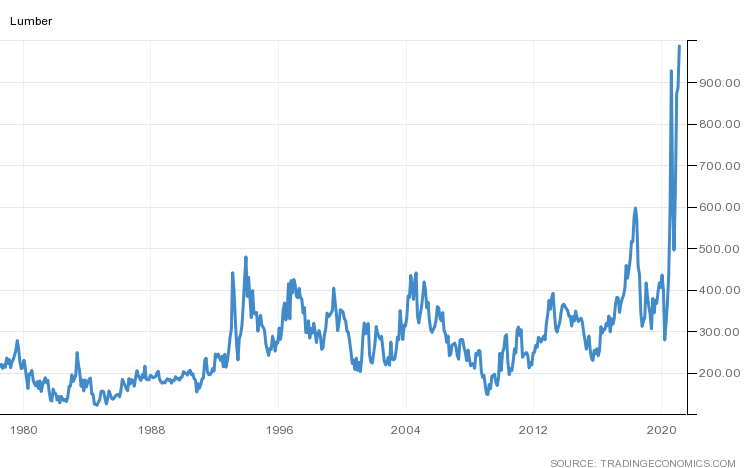
Chart Source: Trading Economics
Freight rates skyrocketed due to a variety of pandemic-related issues and supply chain limitations.
A number of auto makers have had to cut planned 2021 vehicle production due to a severe shortage of semiconductor chips. Most critical chips used around the world come out of Taiwan and South Korea; it's a rather concentrated source of supply for something so critical to the world, and it takes big capex cycles to bring new production online.
Basically, the things that were scarce relative to demand soared in price this past year. Things that were already overproduced and/or in less demand due to the pandemic, such as business attire or gasoline or office space rent levels, have remained relatively low in price.
Asset prices were impacted by this dynamic as well. The stock market soared to record highs amidst the worst drawdown in GDP since the Great Depression. Cyclical/value stocks have been somewhat out of favor, but the amount of money that investors have been willing to pay for growth/tech stocks relative to their earnings has soared.
Here's Apple's (AAPL) stock price (black line) compared to its earnings growth (orange and blue lines), for example:
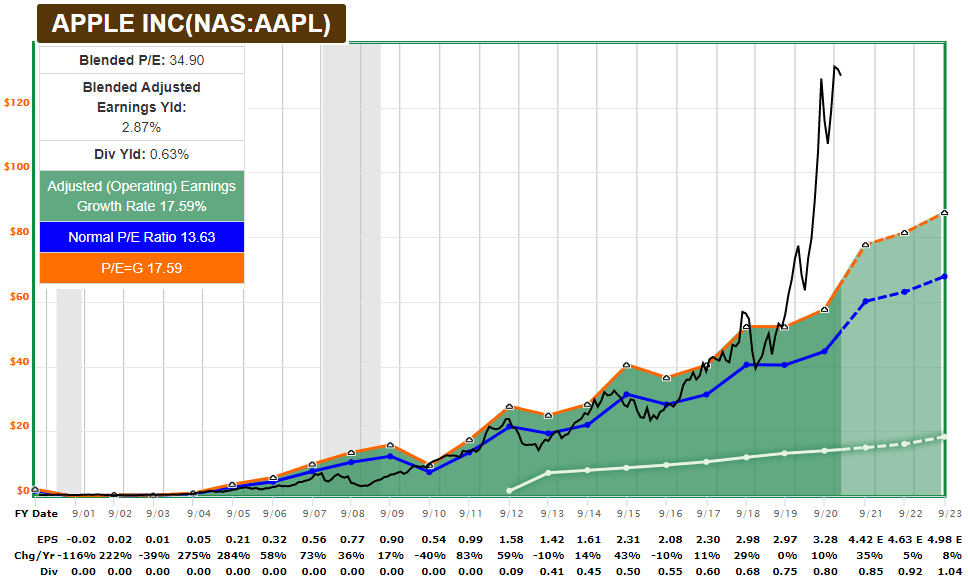
Chart Source: F.A.S.T. Graphs
And here's Cadence Design Systems (CDNS):
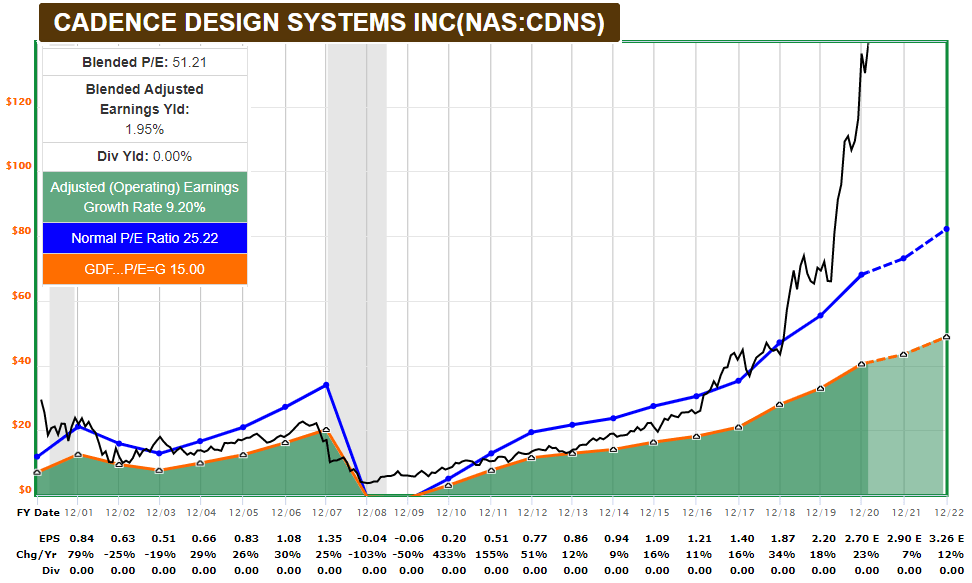
Chart Source: F.A.S.T. Graphs
Even if we don't assume that they will go all the way back down to their typical valuation levels (who knows), it wouldn't be shocking for either of those two stocks, and countless other stocks like them, to fall 10-20% and then go choppy sideways for a few years with bad 5-year forward annualized returns, as an example.
Tesla (TSLA), as another example, had approximately 30% revenue growth in 2020 (a great growth rate), but their stock priced soared more than 700% for the year.
When broad money goes up a lot, price inflation almost always occurs somewhere. The question is what types of assets it occurs in: financial assets or consumer prices.
With low money velocity and low interest rates amid the pandemic, that money has so far showed up in financial assets, particularly bonds and growth/tech names. There's essentially no time value of money when inflation-adjusted interest rates are negative.
However, in recent months the money has been spilling over into consumer prices in uneven ways as well, starting with commodities. If rates rise on the long end of the Treasury curve, it creates some degree of time value for money again, and those growth stocks can face a valuation reduction even as the underlying companies continue to do well.
Ongoing Stimulus Potential
The United States went into this pandemic with $1 trillion in structural annual fiscal deficits, which accounted for about 5% of GDP. This was unusual, because we began expanding our deficit as a percentage of GDP in the middle of an economic expansion, which hasn't happened since the Vietnam War.
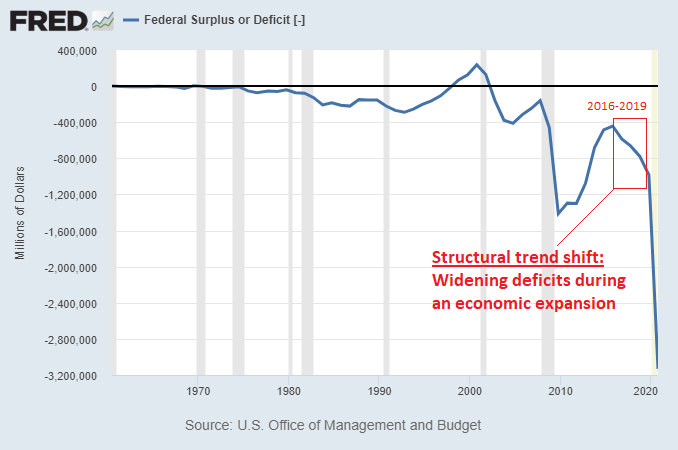
Chart Source: St. Louis Fed
After the $2.2 trillion CARES Act from March 2020, the 2020 deficit was brought up to about $3.2 trillion. Then there was a series of add-ons to it, including a $900 billion second stimulus bill at the end of the calendar year.
Altogether, Treasury Department debt is currently nearly $5 trillion higher than it started 2020 with, having gone from $23 trillion to a little under $28 trillion in one year, although the Treasury Department does have over $1 trillion extra cash in its account as well that remains unspent.
Congress and the Biden administration are working on a $1.9 trillion bill to pass before the end of March. It might end up being a little smaller due to compromises to get it through a tightly-divided Senate, maybe in the $1.2-to-$1.9 trillion range, assuming talks don't fall apart.
From there, a number of politicians are looking at the prospect of federal student loan forgiveness, which if enacted would be anywhere between $400 billion to $1.4 trillion depending on if they go with the Biden plan (up to $10,000 forgiven per person) or the Schumer/Warren plan (total debt forgiveness). To have a chance of getting through the Senate and being signed by Biden, the second option seems unlikely while the first option seems possible.
And from that point, there are discussions about a longer-term and more substantive infrastructure bill, which in theory has rather bipartisan support, but in practice getting a sizable infrastructure bill through Congress hasn't been successful for years because Republicans and Democrats have different ideas of what an infrastructure bill should prioritize and in what constituencies. The pandemic certainly presents a catalyst, which makes it worth watching even though it's certainly not assured. Biden's administration is reportedly aiming for a $3 trillion infrastructure package later this year.
The reason it is important to watch stimulus packages for investment reasons is because this is a very macro-heavy environment, and so the amount and timing of stimulus will play a role in forward inflation levels and performances of various assets. Not just in the United States, but in other major economies as well. The United States just happens to be the largest and most fiscal-heavy, while having the global reserve currency, and so its decisions extend the furthest.
So, we need to separate what we think should or should not be passed, vs what we think will be passed and how it could mathematically impact the money supply, stocks, bonds, commodities, currencies, and inflation levels if passed.
With this macro environment (high debt from long-term structural forces, high wealth concentration, and an economy that is damaged by the pandemic and shutdowns), the government can likely kill inflation whenever it wants by basically shutting off stimulus packages and letting deflation play out, but then they'll have more of a mass-insolvency problem on their hands, along with the potential for another round of civil unrest.
In the other direction, they can address the insolvency issues by running large stimulus and risking higher inflation, which is the path they're aiming for so far. This path comes at the expense of cash-holders and bond-holders, whose yields don't pay enough to keep up with inflation, and thus lose purchasing power over time.
The bottlenecks of civil unrest and other variables, in the end, always push politicians to print. A fiat currency regime with debt denominated in its own currency never collapses from lack of printed money. The question is "how fast and how much" they print, more so than "if" they print.
The Steepening Yield Curve
The yield curve is steepening. This means that the difference in rates between the long end of the Treasury curve and the short end of the Treasury curve is widening.
Here's the 10-year Treasury yield minus the 3-month Treasury yield:
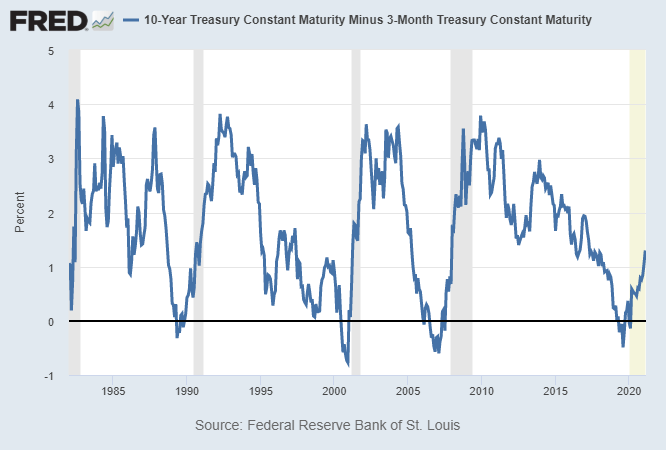
Chart Source: St. Louis Fed
It came pretty far pretty fast over the past couple weeks, so I wouldn't be surprised to see a pause or correction.
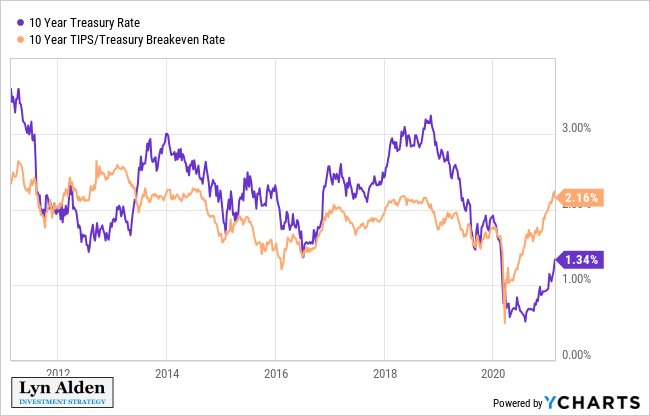
However, Treasury yields remain below inflation expectations, which is somewhat uncommon and shows how much higher Treasury yields could potentially go if left to the actual forces of supply and demand:
With more stimulus likely still coming down the path, the Fed potentially has a decision point on their hands by mid-2021 in terms of Treasury yields.
Their dual mandate is to 1) maximize employment levels while 2) maintaining price stability, which they've defined as about 2% average annual inflation.
They usually respond to low employment and low inflation by cutting interest rates and/or expanding the monetary base. In contrast, they usually respond to high employment and high inflation by raising interest rates and tightening monetary policy.
Things get messy, however, if the economy has low employment and high inflation, which is rather rare. If they try to tame inflation by tightening monetary policy, they risk hurting the weak employment situation. If they try to keep loose monetary policy with the hope that it helps the weak employment situation, they risk letting inflation run too hot.
The 5-year forward inflation expectations by the TIPS market (red line in the chart below) are already pricing in 2.3% forward inflation, which is an 8-year high. Meanwhile, the economy has only recovered about half of the jobs lost so far in the pandemic (blue line below) with a stagnant sideways trend:
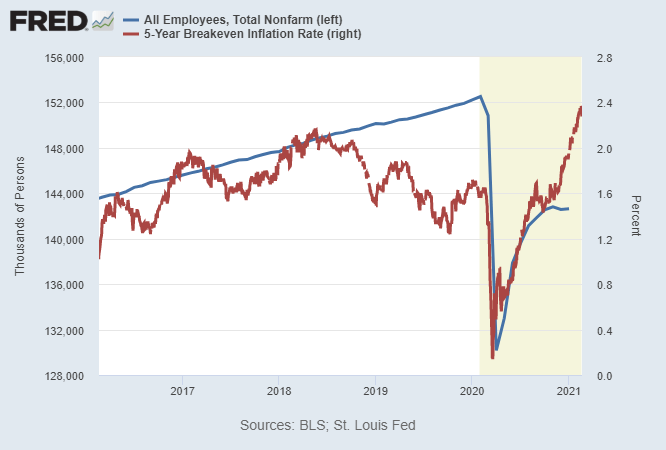
Chart Source: St. Louis Fed
After their massive monetary response in 2020, the Fed already saw this dilemma coming by announcing a plan to have "average inflation targeting". In other words, if inflation does heat up while employment remains weak, they plan to pick the side of supporting employment and keeping interest rates low while letting inflation run hot if need be. They've chosen their side.
The Fed used to treat 2% inflation more like a ceiling; if inflation was getting near or over 2% as they measure it, they'd move towards reigning it in. Now, however, they have said numerous times that they plan to let inflation run hot for a period of time, perhaps 2.5% or 3% for a while, to make up for the fact that they've spent the majority of the past decade below the 2% target in terms of how they measure it, so that the long-run average ends up being about 2%.
So, if inflation does come, the Fed won't be raising interest rates for a while. They've made that clear. Inflation could be 2.5% or 3% for a period of time, and your bank account and T-bills will still be paying nearly 0%.
In fact, cash and T-bills have already been persistent money-losers against inflation over the past decade. This chart shows the 3-month T-bill yield minus the official annual inflation rate over the long run. The 1940s, 1970s, and 2010s were all bad times to be a cash or T-bill holder:
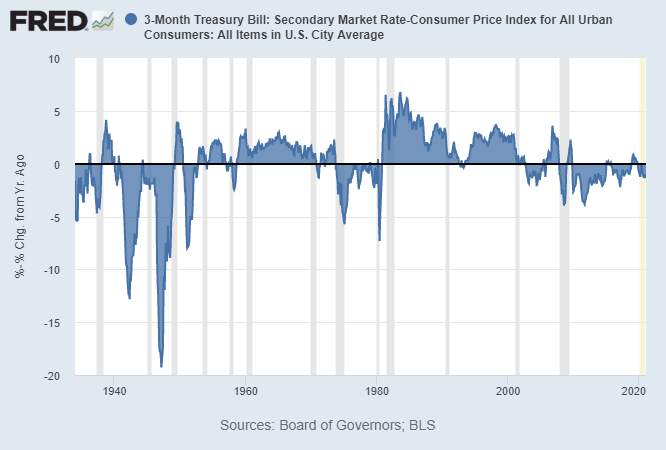
Chart Source: St. Louis Fed
The Fed normally only has direct control over very short-term interest rates.
Long-term Treasury rates, on the other hand, are set more by market forces of supply and demand. The Fed can affect the supply/demand balance by buying long-duration Treasuries as well, but it comes down to how much they are willing to buy.
With more and more fiscal spending planned for 2021 and beyond by Congress and the President, and the Fed buying about $80 billion of Treasuries per month, there's quite a lot of Treasuries left for the private market to absorb.
The question is: will the Fed try in a big way to control the long end of the Treasury curve, such as 10-year, 20-year or 30-year Treasury rates, to keep those low too?
Eventually, they might. However, they're unlikely to be proactive about it, and instead are more likely to let long-term Treasury rates rise until they get high enough to cause problems.
Risk parity funds, highly-leveraged corporate credit, highly-valued growth stocks, and the housing market are all disrupted to varying degrees if rates get high enough.
Lots to Absorb in the Second Half of 2021
Robin Brooks, former chief FX strategist at Goldman Sachs, posted a great chart couple weeks ago that shows US Treasury security issuance as a percentage of GDP, compared to who is buying that Treasury issuance:
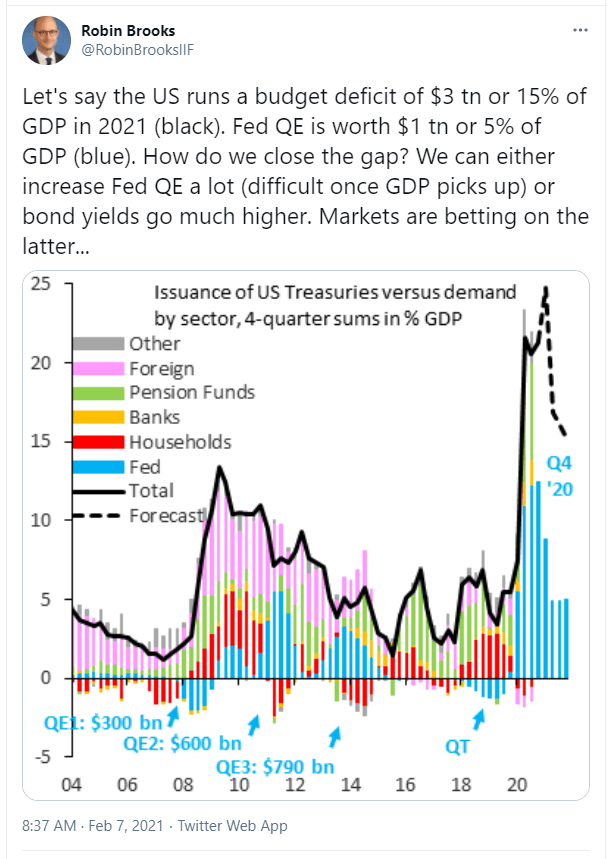
The black line in the chart shows how much Treasuries that the US government is issuing (and expected to issue going forward a bit) as a percentage of US GDP. As you can see, in non-recession periods, it was maybe 2-6% per year, whereas during the 2009-12 period it got as high as 10% on average as tax revenues fell and the government launched fiscal stimulus efforts. More recently, it's hitting the 15-25% range, which is the largest deficit spending since World War II.
Historically, the foreign sector (pink lines in the chart above) was a big buyer of Treasuries, but that mostly dried up in 2015. Pension funds (green lines) and the Fed (blue lines) have been the main buyers since then.
The Fed bought a ton of Treasuries in the first half of 2020 (about $1.9 trillion worth in six months) with new base money creation, but since then they've been buying at a $80 billion per month rate, or about $1 trillion per year annualized.
Within the first half of 2021, the government doesn't plan to issue that many Treasuries to fund government spending, because instead they plan to draw down about $1 trillion from their unspent cash at the Fed to historically normal levels:
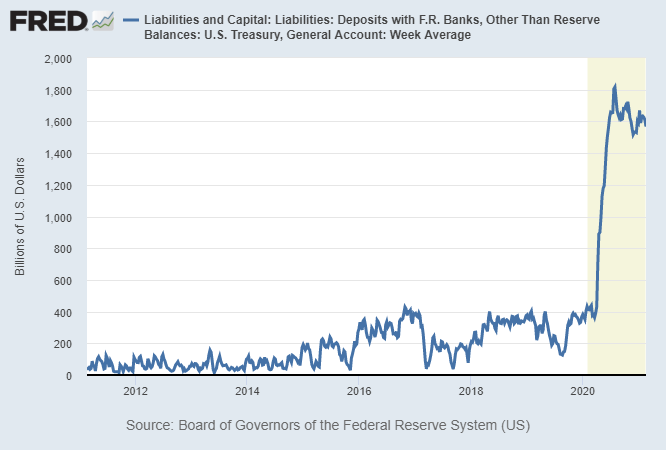
Chart Source: St. Louis Fed
This Treasury General Account is like the government's checking account at the Fed. They built up this extra pile of money by issuing bonds at a faster rate than they've spent money. Now, they're about to spend money faster than they will issue bonds, and thus drive the amount back down to normal levels.
This Treasury General Account drawdown will be a big liquidity boost for the financial system. Almost too much, since it's starting to cause financial plumbing problems via lack of sufficient collateral.
After this drawdown, they'll need to turn to more Treasury issuance. There is likely quite a lot of Treasury issuance coming in the second half of 2021, again assuming that these fiscal packages pass.
For example, if the government runs a $3 trillion deficit in 2021, and draws down their cash account by $1 trillion, they'll need to issue about $2 trillion in net Treasuries. If the Fed buys $1 trillion, that leaves about $1 trillion for the private sector to buy.
On the other hand, if the government runs a $4 trillion deficit in 2021, and draws down their cash account by $1 trillion, they'll need to issue $3 trillion in net Treasuries. If the Fed still buys just $1 trillion, that leaves more like $2 trillion for the private sector to buy. That's a ton, and could very well drive yields up.
Two Types of Yield Curve Control
Back in the 1970s, inflation ran hot and the Federal Reserve kept raising interest rates until they were able to contain it. However, total debt to GDP was at very low levels, which is why the Fed was able to raise rates so high without causing widespread insolvency.
For most people, they use the 1970s as the inflation policy model to reference. If inflation runs hot, they assume that the Fed will contain it.
However, when the government has very high debt levels and is running large deficits, they have to keep funding costs low. Unlike a business or a household, however, they are also the issuer of currency, so along with the Fed, they can finance their debt at whatever rate they want, if they're willing to sacrifice the value of their currency by running at persistently negative inflation-adjusted interest rates.
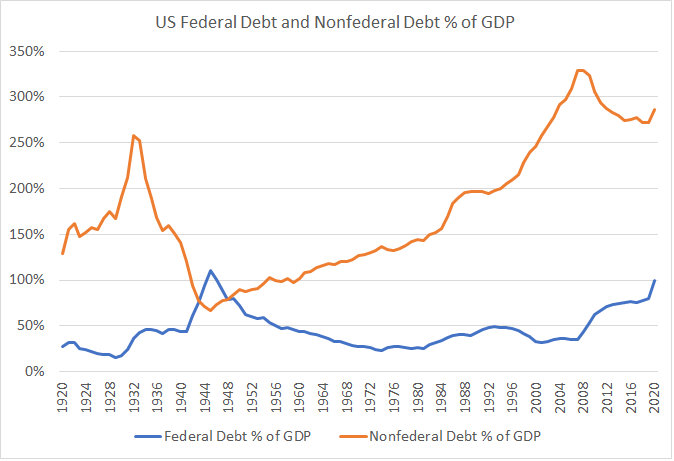
Here is a chart of debt to GDP for the United States, divided into federal and non-federal types.
Data Sources: Census Bureau, Treasury, Federal Reserve
The 2020s look nothing like the 1970s. It's more like the 1940s in terms of fiscal and monetary policy. Federal debt and deficits are very high, so if inflation picks up, the Fed won't be able to raise interest rates very much without causing systemic insolvency.
Yield Curve Control Option 1: Full Spectrum
If the Federal Reserve decides to do so, they can enact yield curve control, meaning they can lock specific parts of the Treasury yield curve or the entire yield curve at whatever rate they want, by being willing to buy as many bonds as needed with new base money to maintain that peg.
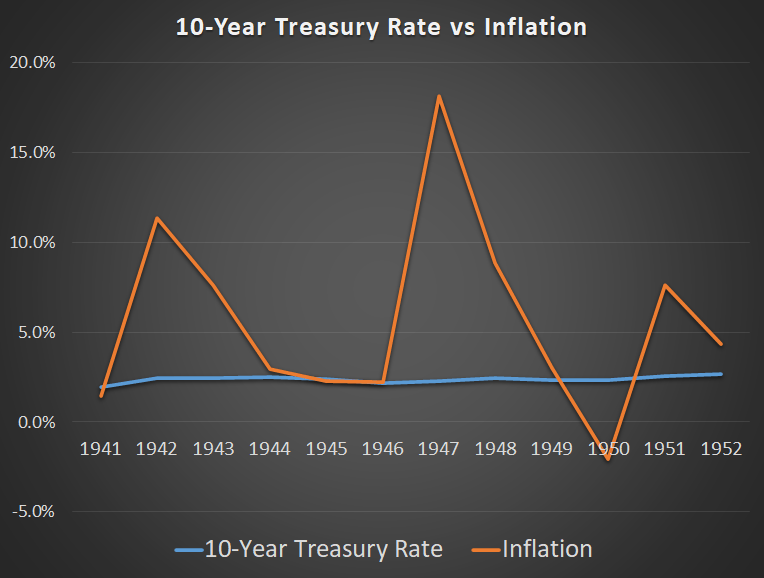
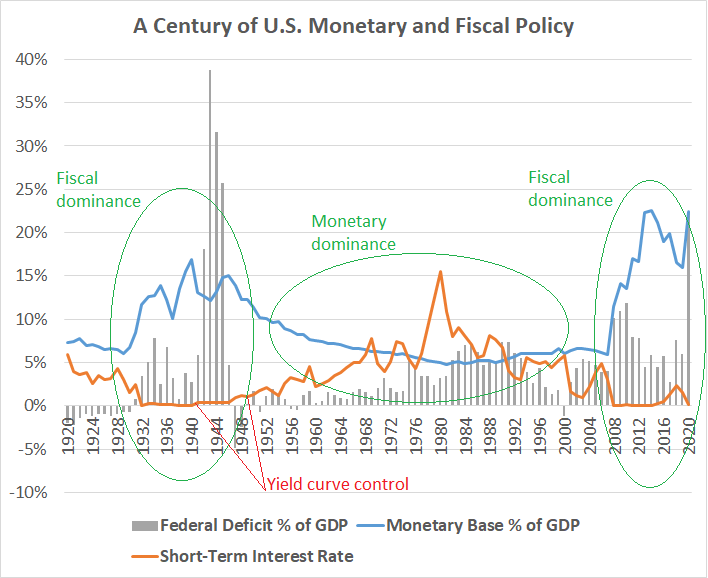
The only time they did this was in the 1940s, which was the only other time in US history that federal debt as a percentage of GDP was this high and inflation was picking up. They locked T-bills at 0.38% and long-duration Treasuries at 2.5% from about 1942 to 1951.
This chart shows the perfectly flat 10-year yield (completely locked at 2.5% by the Fed) vs the high and varied inflation rate throughout the 1940s. The Fed completely overrode market forces:
Data Sources: Bureau of Labor Statistics, Prof. Robert Shiller
In terms of historical context, here is where they did it:
Data Sources: U.S. Treasury Department, U.S. Federal Reserve
However, the Fed hated controlling the yields then, and they would hate doing it now, since it gives up their independence from the Treasury Department. It's only a last resort.
In order to do full spectrum yield curve control in the 1940s, the Fed had to increase their Treasury security holdings by tenfold in three years, mostly via purchases on the short end of the duration curve, since they had to buy all the bonds that nobody else wanted to buy at that rate. They then rotated almost all their balance sheet from short-term debt to long-term debt as the Fed moved closer to getting out of the rate peg. This was quite the technical undertaking:
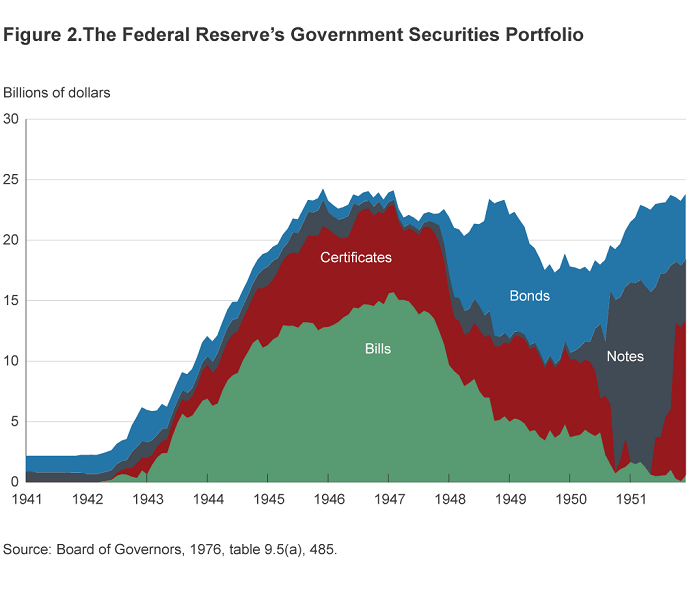
Chart Source: Cleveland Fed
Fed officials discussed this problem in their June 2020 meeting, and the St. Louis Fed published a follow-up article on it in August 2020. The article in particular had a good summary:
Current experiences in Japan and Australia, as well as the Fed's experience in the 1940s, suggest that YCC has been an effective tool at targeting interest rates along some portion of the yield curve. As the minutes of the June FOMC meeting noted, the lessons from these three episodes suggest that a YCC policy can be implemented in such a way as to avoid a significant expansion in the central bank's balance sheet-assuming the absence of an explicit exit strategy designed to reduce the size of the balance sheet. However, those minutes also noted that many FOMC participants had remarked that it was not clear there would be a need to adopt YCC as long as forward guidance remains credible on its own.
However, it is important to acknowledge that every policy has drawbacks. For example, if the Fed were to adopt such a policy and if the public perceives that the Fed is engaged in deficit financing, then it is possible that inflation expectations could rise, threatening the Fed's long-run goal of price stability; this happened in the U.S. in the 1940s and early 1950s and led to the Treasury-Fed Accord in 1951.
Another worry is that YCC could distort market signals, thereby diminishing the value of information that monetary policymakers glean from the Treasury market. Finally, if the Fed were to adopt YCC, policymakers would have to grapple with the challenge of how to exit from policies designed to be temporary departures from normal. Thus, once the economy normalizes, it would be important to convey the YCC exit strategy to the public in a clear manner to avoid potentially destabilizing outcomes.
-St. Louis Fed, August 2020
So, if inflation does pick up and Treasury yields continue to rise to the point of being a problem, it's important to explore other options that the Fed might use before considering going to this heavy-handed solution.
Yield Curve Control Option 2: Front-End Pin
A second way to do yield curve control is to primarily focus on the short end of the curve.
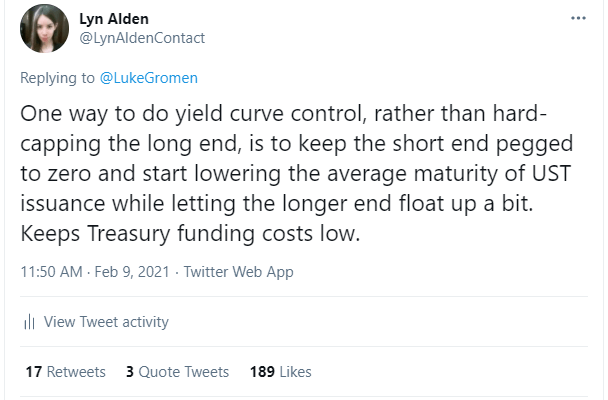
The Fed is willing and able to lock short-term interest rates wherever they want, but they would find it more onerous to outright control the long end of the Treasury curve.
So, one of their options is to keep short-term interest rates pinned near zero, even as inflation runs hot, and let long-duration Treasury yields head higher. In other words, this option would be the Fed not completely working with the Treasury, and maintaining some independence, while still allowing a way to let inflation run hot and for the government to keep its funding costs low.
If the Treasury Department wants to keep its funding costs low while this is happening, they would need to lower the average duration of their Treasury security issuance. Indeed, they began doing this in 2020:
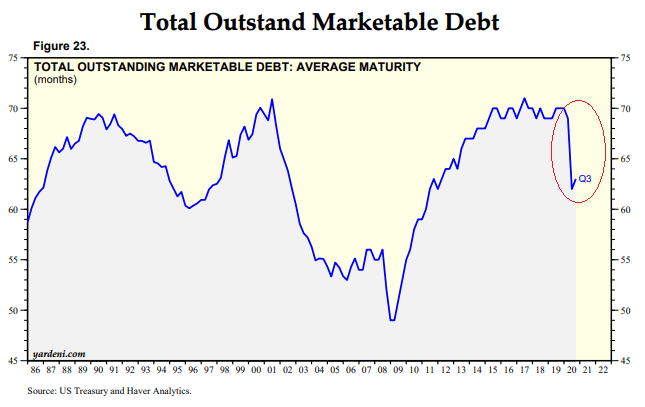
Chart Source: Yardeni
Reducing their duration exposes the Treasury Department and various corporations to more interest rate risk; they have to constantly roll over short-duration debt.
Basically, the first option of full spectrum yield curve control is more accommodative, and represents the Fed being about as dovish as possible and totally overriding bond market pricing, at the cost of basically giving up its independence. The second option represents the Fed trying to be accommodative and partially manipulating bond yields, without outright giving up independence or going full-on maximum dovish.
The first option of full spectrum yield curve control is quite positive for asset prices across the board, other than cash and bonds which would get sharply devalued in inflation-adjusted terms.
The second option of a front-end pin, if long-end Treasury yields continue to rise due to an uptick in inflation, can put downward pressure on several asset classes and take some froth and speculation out of the equity market, but also potentially leads to corporate credit problems occurring. It would likely be good for bank stocks, which borrow at short durations and lend at long durations.
The Investment Flow Chart
Stanley Druckenmiller gave a great interview the other day about his economic outlook and investment positioning.
Here was a key snippet:
I would say my overriding theme is inflation relative to what the policymakers think. But, because of the policymaker response, which could be very varied based on the vaccine and how they respond to various metrics, I found it's better to have a matrix.
So, basically the play is inflation. I have a short Treasury position, primarily at the long end. Because the Fed could drive me crazy, and not let that come to fruition, I also have a large position in commodities. The longer the Fed tries to keep rates suppressed, so they'll have stimulus in the pipeline, the more I win on my commodities. The quicker the Fed responds, the quicker I might have a problem with my commodities.
And then because of the juxtapostion of our [US] policy response vs Asia, I also have a very, very short dollar position.
-Stanley Druckenmiller, 2/3/2021
Druckenmiller is arguably the single best trader over the past 30 years, so it never hurts to see that he has come to similar conclusions as I've been working through in this unusual macro environment.
Some of my articles in summer and autumn 2020 focused on these themes, and we're slowly moving through those scenarios now as we head deeper into 2021.
Druckenmiller's overall investment position, as he describes it in the interview, is long cloud technology stocks, long broad Asian equities and currencies, short Treasuries (meaning he expects the long-duration Treasury yields to rise, and thus Treasury bond prices to fall), long commodities, and short the dollar. His 13F filing showed that in Q4 2020, he did trim some of his cloud stocks but remains long, expressing somewhat of a cautiously optimistic view in favor of more of this reflation theme instead.
Druckenmiller specializes in the bond market, so going long or short bonds with leverage is a key theme of his. I specialize more in the equity space, so I'm using long bank stocks as one of my plays for the potentially rising long-duration Treasury yield, which I also balance with long commodities and foreign equities.
We can think of the investment flow chart like this:
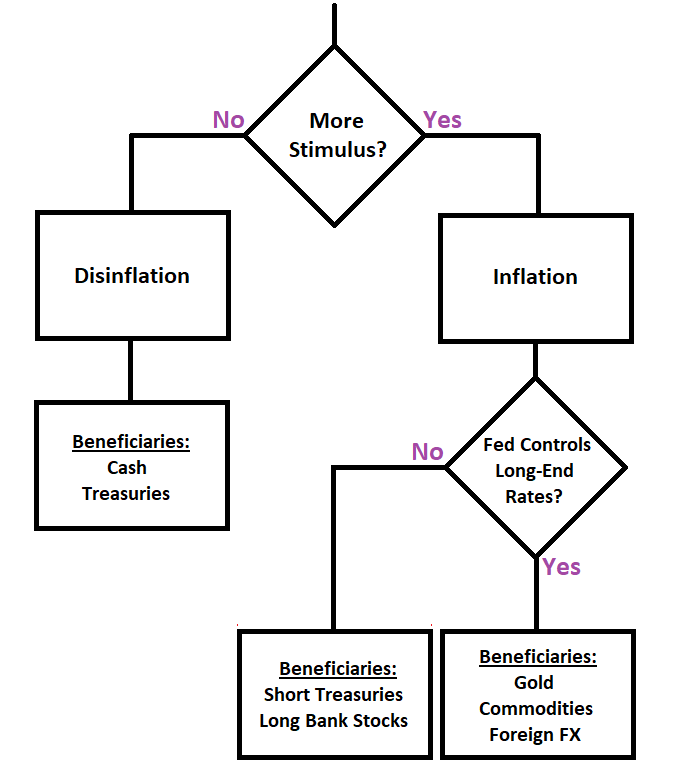
The broad macro landscape within the US really comes down to two decision points, and their ramifications will trickle out internationally as well. Other countries will be making similar decisions, but the US is doing much larger fiscal stimulus and broad money supply expansion than other countries, and so it's a bigger macro event.
The first decision is by Congress and the President in regards to how much fiscal stimulus (and thus inflationary potential) there is, and the second decision is about how the Fed responds to that stimulus if those fiscal policymakers do continue to unleash it.
1) Inflation vs Deflation
With a ton of debt and deflationary forces in the system, fiscal authorities can shift to a period of disinflation or deflation whenever they want by stopping stimulus and reducing the fiscal deficit.
I consider that unlikely, because they would risk economic stagnation, widespread insolvency issues, and civil unrest with this much debt in the system while joblessness remains high. However, if senate negotiations fall through or some other impediment occurs, that's a possibility for a period of time.
One of the things former President Trump is publicly angered about is that Mitch McConnell's Republican-controlled senate blocked the $2,000 checks that Trump agreed with Democrats on in late 2020, and he feels that this was a considerable variable for the outcomes of both the national election and then even more so the Georgia run-off election. Public polls are overwhelmingly in favor of more stimulus.
So, the first thing to watch as it relates to inflation/deflation is if the Biden Administration's ongoing fiscal aid packages materialize or not, with centrists like Senator Joe Manchin that have some degree of political sway to block them or more likely, adjust them slightly. If the stimulus packages don't materialize, then cash and Treasuries are a way to protect against disinflation as this current cyclical move winds down.
If we expect more stimulus and inflation, as I do as my base case, then we move onto the next step.
2) Does the Fed Suppress Long-Duration Rates?
If we get inflation, the natural direction for Treasury rates to go is up. Potentially way up. That presents problems for Treasury bondholders, for cash holders, for credit markets, for US government financing, for mortgage/housing market, for risk parity funds, and for growth stock valuations.
To zoom in on that last one, I described in one of my recent articles how higher rates would be a big impediment for high-valued growth stock performance going forward.
As previously described, the Fed is likely to keep intervening in some way, at least keeping the short end of the Treasury curve pinned, but they might or might not let long-duration Treasuries rise. My base case is they'll let them rise until it starts to break something in the financial system (like the December 2018 taper tantrum, or the September 2019 repo rate spike), at which point they might be basically forced to suppress the long end of the curve as well, as a matter of financial stability.
If the Fed doesn't suppress the curve and therefore lets long-end Treasury rates run up, then shorting long-duration Treasuries is a direct play to benefit from higher yields, and buying bank stocks (which fundamentally benefit from steeper yield curves) would be an indirect play. Commodities would probably be a decent play, and the dollar relative to other currencies would probably be moderate, with both bullish or bearish scenarios as possibilities. You could also hedge your equity position by shorting some of the most bubbly growth stocks, since this situation would likely pressure them. And, there's an ETF called the Quadratic Interest Rate Volatility and Inflation-Hedge ETF (IVOL) that explicitly benefits from yield curve steepening.
If the Fed does suppress the curve and keeps long-end Treasuries down despite higher inflation, then commodities and gold and bitcoin would likely be huge winners, along with anything that would benefit from a much weaker dollar, like overseas equities. Bank stocks would likely do okay, growth stocks might have a mixed time but not as bad as the steep curve scenario, and shorting long-duration Treasuries would be lackluster.
Naturally, I'm playing a bit of both scenarios. I'm long commodity producers, bank stocks, overseas equities, bitcoin, and gold within my portfolio mix.
My base case is that fiscal authorities will do more stimulus, the long end of the Treasury market will rise, and then we will see some sort of market problem occur. At that point, we'll see if the Fed suppresses the long end of the Treasury curve. I'll adjust my view over time as more data points come in.
If we look at the financials ETF (XLF) vs gold (GLD) over the past decade and a half, we see that more often than not, they have an inverse correlation:
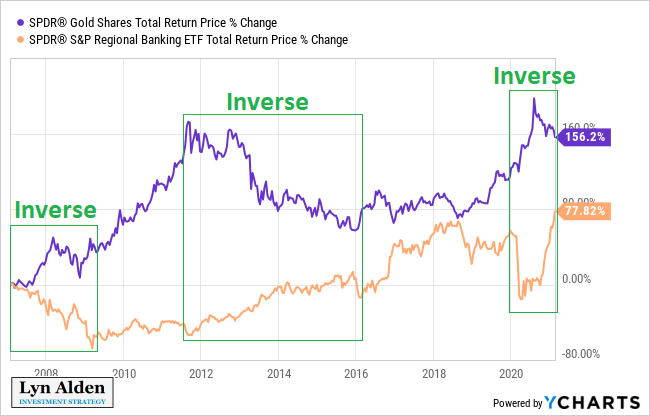
Which one is doing better at a given time generally depends on what real rates (Treasury rates minus inflation breakevens) are doing.
There are scenarios where they can go both go up and down together. In fact, a period of substantial inflation, with a moderate steep yield curve that is mostly submersed below the prevailing inflation rate while broad money increases at a substantial rate, is one such environment where both can do reasonably well. That's one of the environments I think is likely to occur.
Final Thoughts
Over the past three decades, the S&P 500 with dividends reinvested has risen in the ballpark of 20x.
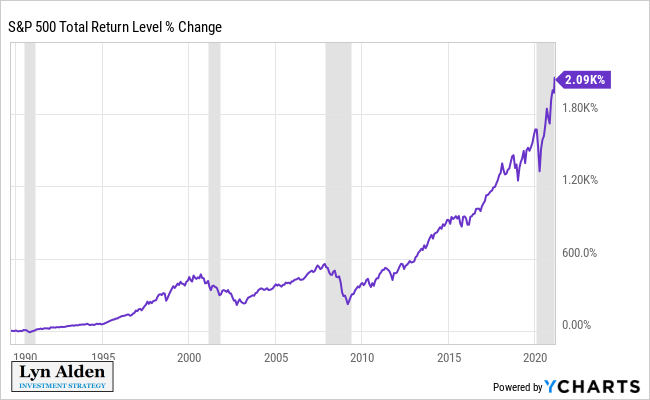
This performance is in large part from earnings growth, but also due to higher average valuations applied to those earnings. In other words, investors used to pay maybe 15 times the earnings per share for a good stock, and now they pay more like 35 times the earnings per share.
S&P 500 valuations have long since been somewhat inversely correlated to 10-year Treasury rate. Starting in 1980, we hit a long-term top in interest rates (red line below), and have been on a four-decade disinflationary trend. During this time, stock valuations (blue line below) have gone almost straight up, with an extra bubble in 2000 but then structurally continuing until the present day:
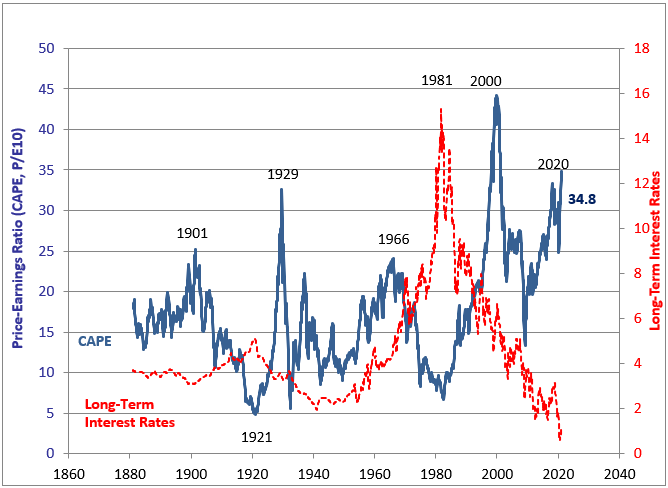
Chart Source: Prof Shiller, Yale University
The trend of rising earnings and higher price/earnings ratio has been like rocket fuel for stocks for a long time. However, if interest rates merely stay flat, let alone go up, that could start to pressure this multi-decade trend of valuation expansion.
In this first half of 2021, there are two big fiscal/monetary forces to be aware of on each hand.
On one hand, if fiscal policymakers pass another aid package in March and the Treasury Department draws down its Treasury General Account, that would add a lot of liquidity to the system and should be beneficial for risk assets.
On the other hand, if long-duration Treasury yields continue to rise due to normalizing or accelerating inflation levels, that can put a lot of pressure on highly-valued growth stocks, risk parity funds, and other parts of the financial market.
In terms of equities here, it's important to know what you own, why you own it, and what you think it's worth in terms of long-term free cash flow generation potential with appropriate discount rates.

