Showing posts with label INVESTING. Show all posts
Showing posts with label INVESTING. Show all posts
Tuesday, August 15, 2023

Sunday, February 5, 2023
U.S. Consumer Is Starting to Freak Out - WSJ
The U.S. Consumer Is Starting to Freak Out

By Harriet Torry
Jan. 30, 2023
The engine of the U.S. economy—consumer spending—is starting to sputter.
Jazzlyn Millberry in Pickerington, Ohio, has been visiting multiple grocery stores to look for the best deals./ANDREW SPEAR FOR THE WALL STREET JOURNAL
Retail purchases have fallen in three of the past four months. Spending on services, including rent, haircuts and the bulk of bills, was flat in December, after adjusting for inflation, the worst monthly reading in nearly a year. Sales of existing homes in the U.S. fell last year to their lowest level since 2014 as mortgage rates rose. The auto industry posted its worst sales year in more than a decade.
It’s a stark turnaround from the second half of 2020, when Americans lifted the economy out of a pandemic downturn, helping the U.S. avoid what many economists worried would be a prolonged slump. Consumers snapped up exercise bikes, televisions and laptop computers for schoolchildren during lockdowns. When restrictions were lifted, they rushed back to their favorite restaurants and travel destinations.
And they kept spending, helped by government stimulus, flush savings accounts and cheap credit, even as inflation picked up. Faced with four-decade-high inflation last year, Americans outspent it. Through most of 2022, consumer spending growth exceeded price increases by about 2 percentage points.
Now the forces that helped keep spending high are unwinding, while inflation remains elevated. The share of monthly income Americans set aside for savings was 3.4% in December, down from 7.5% a year earlier and from a record high in April 2020. Credit-card interest rates have been rising, and Federal Reserve officials have signaled that they plan an additional quarter-percentage point increase to the central bank’s benchmark rate this week. That would bring the rate to between 4.5% and 4.75%, from near zero at the start of last year.
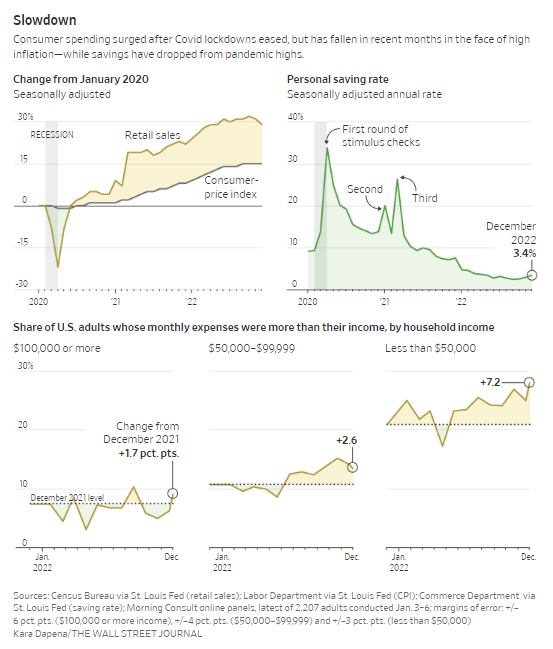
Annual inflation, as measured by the consumer-price index, remained above 5% in December for the 19th straight month, the longest such streak since the early 1980s.
Consumer spending accounts for roughly 70% of the economy. A downshifting consumer is a key reason that business and academic economists polled by The Wall Street Journal, on average, put the probability of a recession in the next 12 months at 61%. However, many economists say, the U.S. might avoid a recession entirely if spending patterns stabilize.
One factor making forecasting more difficult: While unemployment is trending at a half-century low, big companies including Amazon.com Inc., Goldman Sachs Group Inc., and Microsoft Corp. have begun to cut jobs.
“The last bastion of strength is the labor market, but I don’t think it can withstand all these other forces,” said Nationwide Chief Economist Kathy Bostjancic.
Recent layoff trends worry Benjamin DeLong, a 32-year-old customer-account manager at an industrial manufacturer in southern Minnesota. His savings rose to $3,700 during the pandemic, thanks in part to government stimulus. He is now down to about 3 cents.
Mr. DeLong said he had to dip into his savings to cover the rising costs of his groceries, utilities and car insurance. He has found some relief in his grocery bills since he and his partner decided last year to purchase some pigs, jointly with other families, to be raised on a relative’s farm. Their portion of meat yielded nearly 150 pounds, saving them about $500 on groceries, Mr. DeLong estimated.
The possibility of layoffs, he said, is “part of the crunch that I’m having to consider now. What’s going to happen if I no longer have an income?”
Shoppers in New York./PHOTO: GABBY JONES FOR THE WALL STREET JOURNAL
So far, jobs have remained plentiful and wages continued to rise in the face of Federal Reserve tightening. Unemployment was a low 3.5% in December. Hourly wages were up a robust 4.6% year-over-year. There were about 10.5 million unfilled jobs available in November, according to the Labor Department, a sign that demand for labor remained strong.
“Households had a ton of comfort they don’t normally have about their job prospects,” said Marianne Wanamaker, an economist at the University of Tennessee. “They knew they could get a job tomorrow if they wanted to, and that remains mostly true.”
Still, there are signs of labor-market weakness. Employers are shedding temporary workers at a fast rate, and people who lose their jobs are taking longer to find new ones. Meanwhile, the number of hours worked a week has declined for two straight months, according to the Labor Department, resulting in a slowdown in workers’ take-home pay.
Mikhail Andersson, owner of First Class Tattoo in New York City, has seen signs of weakening demand. After it was cleared to reopen from lockdowns in the summer of 2020, his business was slammed by customers flush with unemployment insurance payments and stimulus checks.
In mid-November of last year, Mr. Andersson started getting calls from clients who had booked daylong tattoo sessions, saying they could only afford shorter ones or pulling out altogether. Mr. Andersson, who specializes in tattoo projects that often take five or six all-day sessions to complete, had 15 cancellations for full-day slots in December.
“In my 15 years doing this, I’ve never seen that—people calling up and saying they don’t have the money to spend right now or can only afford an hour because their current situation is pretty bad,” he said.
For now, First Class Tattoo isn’t likely to slash prices because the baseline level of demand remains strong. Some 250 clients are still on the wait list.
Also weighing on many consumers: The rapid increase in rates in the past year, tied to Fed tightening, has pushed the cost of all types of debt higher.
Mortgage rates reached a 20-year high last fall. Some 57% of consumers were concerned about making housing payments in the fourth quarter, according to a survey by Freddie Mac, up from 48% in the third quarter.
The increases are gradually starting to slow down consumer spending, though it might take a while before the effect is fully realized.
“We’re probably going to have higher interest rates around for quite a while. You would think eventually that would dampen consumption, although that we haven’t had the full effect yet,” said Harvard University economist Kenneth Rogoff.
Credit-card balances were up 15% on the year in the third quarter, according to the Federal Reserve Bank of New York, the largest increase in more than two decades.
Additionally, tens of millions of Americans are set to start or resume making payments on student loans later this year, after the Supreme Court rules on President Biden’s student-debt cancellation plan. Payments have been frozen since March 2020, and are scheduled to begin again 60 days after litigation is resolved or the program is implemented.
Many taxpayers will get smaller refunds when they file their returns in the coming months because Congress didn’t extend the breaks put in place at the height of the pandemic.
Most Americans who lose their jobs can expect unemployment payments for six months or less, at a fraction of their former paychecks, the same as before pandemic programs kicked in. Pandemic programs allowed Americans to receive unemployment payments for as long as 18 months, and in some cases paid workers more than their paychecks.
The previously generous jobless benefits and direct federal payments to households caused the share of income Americans save every month to hit new highs in 2020. Since then, the saving rate has fallen to roughly 3% of monthly income, from more than 30% at the start of lockdowns. In 2019, the year before the pandemic, the rate was 8.8%.
The large stock-market declines over the past year also alarmed consumers, including Scottsdale, Ariz.-based Sara Laor, who is 57 years old. Ms. Laor said the declines depleted the holdings in her 401(k) and IRA accounts by nearly 40%.
Over the past year, her family has had to dip into their savings to pay for essential car and plumbing repairs. They are putting off other expenses, like buying a new car, and have given up ordering in meals.
She’s trying to spend more cautiously, shunning recipes involving pricey eggs and buying more canned food.
“Everything I do just feels like I’m a lot poorer: Can I do this or can I do that?” she said.
U.S. factories, shippers and importers are pulling back, a sign they anticipate less demand from Americans in the months ahead.
Inbound volumes at the ports of Los Angeles and Long Beach in California were down 20.1% in December from a year earlier, and have been behind 2019 levels since August. A little over a year ago, backlogs at ports were drawing President Biden’s attention.
Nicholas Hobbs, chief operating officer of J.B. Hunt Transport Services Inc., which manages truck and rail shipments, said the company has seen demand fall off for big and bulky products, including appliances, furniture and exercise equipment—although off-price retailers with discounted inventory are shipping more.
Jazzlyn Millberry, 33, has been looking for big ways to make cuts. One day last fall, her banking app informed her that the cost of one month’s groceries and household goods for her family of four had risen to $900, from about $600 or $700.
“I find myself now going to three or four different grocery stores just to get the best deals on things to save on costs,” said Ms. Millberry, a health-insurance claims analyst in Pickerington, Ohio.
On one recent outing, she stopped at Kroger for eggs and meat, Aldi for produce, Sam’s Club for her children’s snacks, and Target for toilet paper.
Even as she has cut back on groceries, restaurants, hairstyling and facials, her credit-card balances have grown in the past several months. She said she started making only the minimum required payment on her credit cards.
Gwynn Guilford and Paul Page contributed to this article.
Write to Harriet Torry at harriet.torry@wsj.com
Dow Jones & Company, Inc.

Sunday, November 20, 2022

Wednesday, September 14, 2022
Farrish on Economy - BOOM!!!
PRICES RISE AND STOCKS FALL
The markets spent four days rallying off the lows on the belief that inflation had peaked… oops! Food and services jumped higher than energy fell showing more inflation than expected last month. That sent the markets lower during premarket hours. The S&P 500 index opened down more than 2% and closed down 4.3% for the day. The four-day rally gained 5.1%… thus, we gave up most of the bounce. The ten-year bond rose to 3.42%. The dollar was up 1.4% and the volatility index jumped 14.2%. It was quite the day for the downside. I hate to remind you we have been talking about the unrealistic view that inflation was done and that the Fed was done. We may see a relief bounce but the downside is likely to continue as the reality of the global economic situation sinks in. We have not seen the worst of food inflation yet. The Fed is likely to push rates to 4.1-4.5% for the Fed Funds Rate. That would have quite a slowing effect on the economy. All said, the downside is still in play and the rally is muted for now. Watching how Wednesday unfolds and looking for opportunities in the move.
Things to Watch on Wednesday: 1) PPI Final Demand August (-0.5% previous. -0.1 expected). 2) The Buyers response to Tuesday? 3) Energy isn’t done… watch for upside moves. 4) Mortgage demand falls 29% Y/Y. Mortgage rates move above 6%. ITB/XHB falling.
This Week’s Data Reports:
Tuesday: 1) CPI (0.1% August versus 0% previous. -0.1% expected) Core CPI (0.6% August versus 0.3% previous. 0.3% expected) CPI Y/Y (8.3 August versus 8.5% previous. 8% expected). CPI Core Y/Y (August 6.3% versus 5.9% previous. 6% expected). Expectations were for inflation to decline based on energy prices falling. They would have except food and services rose much more than expected. +0.8% for food… +11.4% Y/Y largest increase since May 1979. End results markets fell more than 4% on the news.
Monday: NONE.
Quote of the Day: “There is only one kind of shock worse than the totally unexpected: the expected for which one has refused to prepare.”― Mary Renault.
The S&P 500 index closed down 177.7 points to 3932 it was down 4.32% with above-average volume. The index gapped lower and closed near the lows of the day. The reality of inflation hit the markets as investors figured out inflation isn’t just energy prices. We were predominately in cash and short positions so it was a simple day to manage. We added to short side positions and now we let this all play out. Eleven of eleven sectors closed lower on the day with energy the best sector on the day down 2.5%. The downside was led by technology off 5.5%. The VIX index closed at 27.2 rising along with the market. Watching the aftermath on Wednesday.
Sector Rotation and the S&P 500 Index:
Tuesday: Finished the day on the downside as buyers leave the market. Watching how this unfolds near term how the optimism responds to the selling… do they see this as another buying opportunity? The index is testing the September lows on the move and if they break the June lows will come into play. The focus of late was investors believing the worst case is priced into stocks. They found out that was not the case and looking forward things could get worse before they get better. Plenty to ponder as we manage our risk and adjust stops.
XLB – Basic Materials bounced at the near-term lows and back above the 50 DMA. The sector was up 4.9% for the week. Erased 3.6% of the gains.
XLU – Utilities Tested the $74.25 support and held for now. The sector was up 2.6% for the week and still in an uptrend. Moved above the August highs… fell 2.6%.
IYZ – Telecom moved to the June lows and bounced. Still not looking healthy on the chart. The sector was up 0.4% for the week. Erased all the gains of the last four days… down 4.4%.
XLP – Consumer Staples moved back to the 50 DMA after testing support at the $72.16 level. The sector was up 0.6% for the week. Erased all the gains of the last four days… down 3.4%.
XLI – Industrials bounced at support and moved back above the 50 DMA. The sector was up 2.4% for the week. Erased all the gains of the last four days… down 3.7%.
XLV – Healthcare moved to support at $125 and bounce back above the 50 DMA. The sector was up 2.9% for the week. Hit the 50 DMA and fell back… down 3.3%.
XLE – Energy tested the $76.80 support and bounced to close the week. The sector was up 2.6% for the week. Watching crude prices which tested lower all week but bounced on Friday. Gave up 2.5% remains in a trading range.
XLK – Technology added to the downside and remains below the 50 DMA. Semiconductors have been the drag on the sector. The sector was up 1.9% for the week. Erased all the gains of the last four days… down 5.3%.
XLF – Financials closed above the 50 DMA and bounced off support at the $32.50 level. The sector was up 3.6% for the week. Moved lower selling off 3.7%.
XLY – Consumer Discretionary back above the 50 DMA and cleared $162.30 resistance. The sector was up 1.9% for the week. Moved lower selling off 5.1% to the 50 DMA.
IYR – REITs bounced at support and back above the 50 DMA. The sector was up 3% for the week. Sold lower giving up 3.7%.
Summary: The index started the week higher adding to the bounce off the lows. Then came the CPI data and the markets gave up nearly 80% of the gains from the previous four days. Taking what is offered but not making any assumptions as the data remains on the negative side. Geopolitics remains a big headline for the markets as winter approaches and Europe remains cut off from Russian energy. Interest rates rose on the 10-year bond. Fed still talking about rate hikes at September 20th meeting. Thus, the markets rallied ignoring everything reported. We have remains in cash and holding short-side positions. We will manage this moving forward and take the opportunities presented. Plenty of challenges on the horizon as we proceed with caution and take what the market gives us. Remember two things currently; first, the trend is your friend, and second, don’t fight the Fed.
(The notes above are posted at the end of each week based on activity from the previous week’s trading. The BOLD/ITALIC comments are the current-day changes worthy of note.)
KEY INDICATORS/SECTORS & LEADERS TO WATCH:
The NASDAQ index closed down 632.8 points to 11,633 as the index was down 5.1% for the day. The index moved lower and back below the 50 DMA. The technology sector led the downside with semiconductors off 6.2% erasing the move over the last four days. Managing our positions and letting this unfold… Wednesday’s response will be of interest… won’t be surprised to see some buying into the selling, but the sellers are likely to take control near term.
NASDAQ 100 (QQQ) was down 5.48% with the large caps selling on the day. The sellers controlled the day with 100 of the 100 stocks closing in negative territory. The technology sector led the downside with semiconductors showing the worst performance. Watching how it unfolds moving forward relative to sentiment and activity. Volume was above average on the selling.
Semiconductors (SOXX) bounced off support at the $353.13 level. Closed the week with a solid gain. The sector was up 3.5% for the week. Bounced but not leading? Erased all the gains fell 6.2%.
Software (IGV) The sector moved back above the 50 DMA with a solid upside move to close the week. The sector was up 4.8% for the week. Showing some leadership? Gave up 4.6% and back below the 50 DMA.
Biotech (IBB) The sector tested the $119 support and bounced back above the 50 DMA. The sector was up 4.2% for the week. Stalled on Monday, sold on Tuesday down 4.5%.
Small-Cap Index (IWM) The sector moved back above the 50 DMA bouncing off support. The sector was up 3.2% for the week. Gave up 3.9% and back below the 50 DMA.
Transports (IYT) held support as the sector closed above the 50 DMA. The sector was up 2.5% for the week. Fell 3.7% and back below the 50 DMA.
The Dollar (UUP) The dollar faded for the week on talk of the Fed resting follow the next hike. The dollar was down 0.61% for the week. Regained all the previous losses.
Treasury Yield 10 Year Bond (TNX) The yield closed the week at 3.32% up from 3.19% last week. Fed talk all week pushed rates higher. TLT was down 1.2% for the week. Moved to 3.42%.
Crude oil (USO) volatility in oil prices as clarity on consumption is still a challenge. China’s economic data isn’t helping the cause. The close Friday was $84.91 down from $87.26 last week. Crude closed down 2.7% for the week. Watching inventory data near term. Lower to $87.63 no big reaction from CPI.
Gold (GLD) The commodity found some buyers on after testing $157.29 support, but is still in bottoming pattern. The downtrend remains in play as gold gained 1.2% for the week. Dollar rallied… Gold fell.
OTHER SECTOR NOTES & DATA:
Put/Call ratio was 1.15 Tuesday… short side and hedging activity.
Energy: The Biden Administration in the first 21 months issued the fewest oil and gas leases since the 1940’s. Take that along with the pander to other countries for oil? Throw in the fact that they have removed and sold 8.54 million barrels from the Strategic Petroleum Reserves putting it at the lowest level since 1984. And, gasoline is 76% higher than when he took office.
Railroads: Workers are preparing to go on strike… which will not help supplies move throughout the country.
Breakouts of Note:
Questions to Ponder: Navigating Uncertainty
Uranium (URA) moving higher on the news that Japan is opening more of its nuclear power plants. Up 7.5% for the week. Hit stops on Tuesday.
FINAL NOTES:
Tuesday: The indexes gapped lower as the inflation data rocked the optimism of the last four days. The selling was across the board with interest rates and the dollar moving higher. All of the eleven sectors closed in negative territory on above-average volume. The one thing we have discussed plenty over the last four or five months is the price of food rising due to weather hampering production along withe the war in Ukraine. We have not seen the worst of this yet. Food inflation is going to be the biggest challenge looking forward. The energy issues in Europe will be real as well impacting imports to the US. All of this has been put on the backburner… but the reality is staring to show up in the data. That will likely create volatility as we have seen in the ups and downs of late. Follow the money. The last four days the buyers were in charge, now we see if that has shifted to the sellers, or was it a one-day event? Watch for the volume, direction, sentiment, and volatility levels to lead you to what takes place. CPI data was not great, but it can get worse before it gets better. There are plenty of moving parts, we have to understand that truth/reality eventually plays out in the markets. Until then we will continue to take what is offered and manage the risk that is.
As stated above we continue to watch and take what is offered. Our longer-term view is still negative, but nothing goes straight down or up… there are always positive and negative swings in a longer-term trend. Recession talks are alive and well. Inflation will continue for some time regardless of the peak inflation talks. We remain focused on short-term trades until there is directional clarity. This strategy has worked very well over time. Know where you are now, know what is happening now, and know what is on the horizon… act accordingly. The key now is to manage the risk of positions, take what is offered… short or long, and then manage the risk.
“Vision without action is a daydream… Action without vision is a nightmare.” Japanese proverb
The goal of these notes is to allow you, the investor, to learn how to see the market development as the progression through the sector develops based on news, speculation, and data. Data drives long-term results and develops trends… speculation and news are short-term drivers and offer higher risk trading opportunities. Through the use of both technical and fundamental data, we can have greater confidence in our trading strategies with a disciplined approach to investing and managing the risk of our money.
MARKETS Sept 14, 2022
MARKETS |
| |||||
| |||||
| |||||
| |||||
| |||||
| |||||
*Stock data as of market close, cryptocurrency data as of 10:00pm ET. Here's what these numbers mean. | |||||
 Breaking Bad/AMC via Giphy Breaking Bad/AMC via Giphy
|


Monday, September 12, 2022
Thursday, September 8, 2022
MARKETS: YEAR-TO-DATE Sept 5, 2022
MARKETS: YEAR-TO-DATE |
| |||||
| |||||
| |||||
| |||||
| |||||
| |||||
*Stock data as of market close, cryptocurrency data as of 8:00pm ET. Here's what these numbers mean. | |||||
|
Monday, August 1, 2022
MARKETS: YEAR-TO-DATE Aug 1, 2022
MARKETS: YEAR-TO-DATE |
| |||||
| |||||
| |||||
| |||||
| |||||
| |||||
*Stock data as of market close, cryptocurrency data as of 7:00pm ET. Here's what these numbers mean. | |||||
|
Subscribe to:
Posts (Atom)